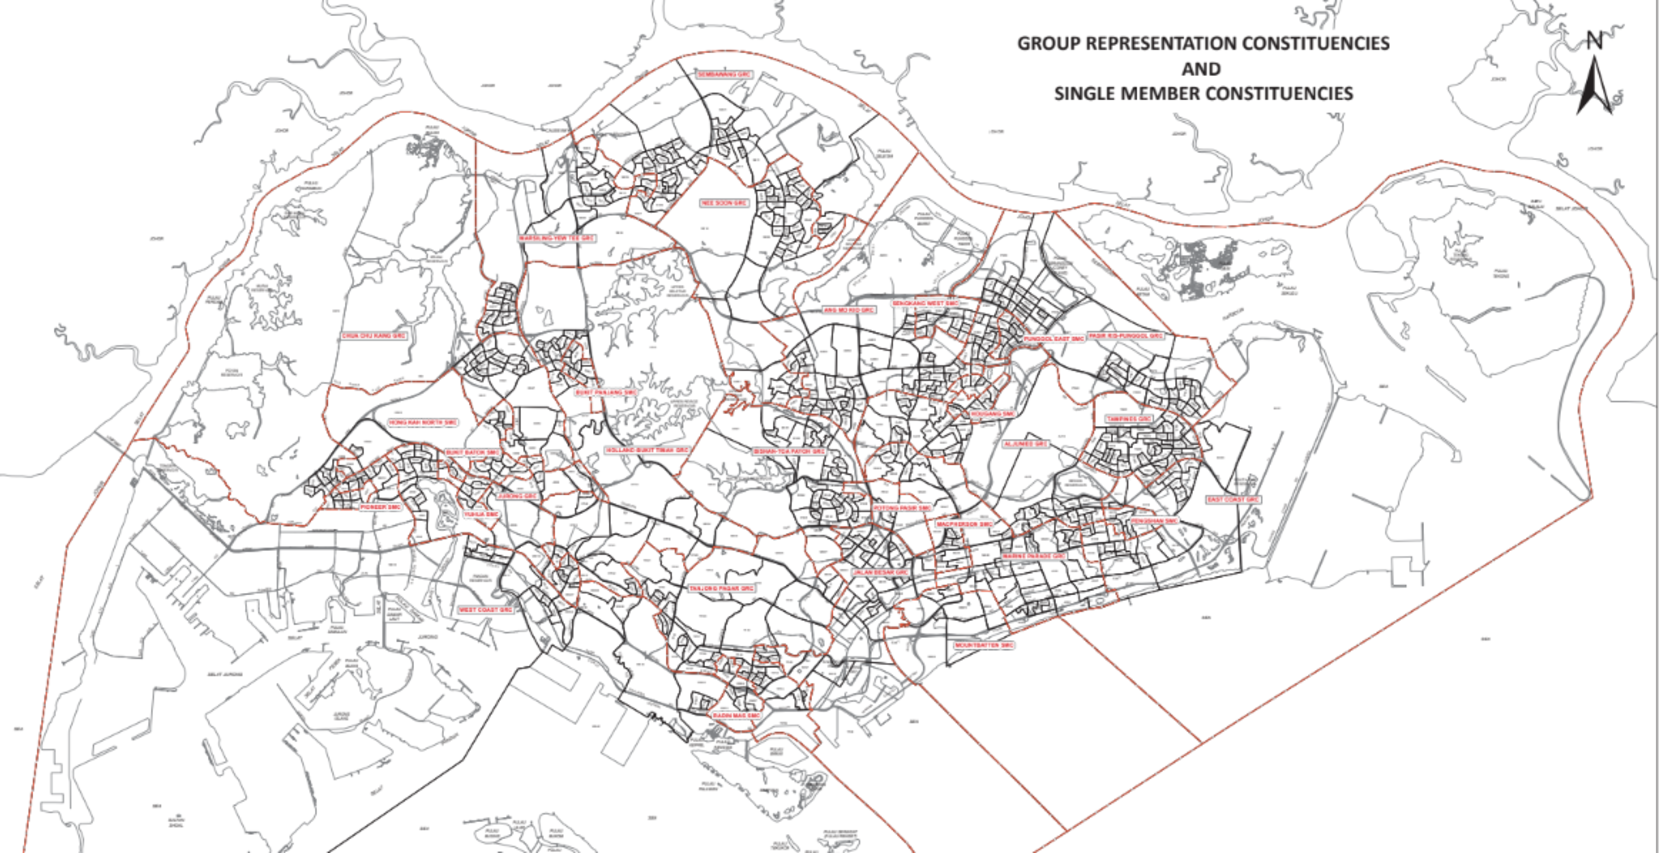
Header image: EBRC Report (2015)
My childhood home has moved through three different districts over five elections.
In 1997, it was in the Joo Chiat ward of East Coast GRC, before becoming part of Joo Chiat SMC in 2001, and finally being absorbed into Marine Parade GRC in 2015. It’s still there for now, but where it’ll be next is anyone’s guess.
One of my colleagues, meanwhile, has gone from being in Yio Chu Kang SMC to Ang Mo Kio GRC to Yio Chu Kang again.
If this were any other country, it would be ridiculous. Imagine a Brit belonging to Nottingham one year, Leicester the next, and Northampton the year after. The whole thing beggars belief.
But this is Singapore, and this is the game we have come to expect from how our electoral boundaries are drawn up.
The top-secret delineation process is carried out by the Electoral Boundaries Review Committee (EBRC). For everyone outside the black box in which they operate, it remains an absolute mystery. Each time a new report is released, we can only scratch our heads as districts are repeatedly carved up, subsumed, created, and reformed.
The changes are unpredictable, but seen over a longer period of time, they look meaningless. GRCs go from 4 seats to 5 and back to 4 again, while SMCs disappear in one election and reappear in the next. Wards begin life as GRC seats, get carved out into SMCs, and then complete the circle by getting re-absorbed into GRCs.
We are never told exactly why.
To anyone on the ground, it makes no sense whatsoever. And after year upon year of switcheroo, it all starts to seem not only incomprehensible, but arbitrary. We don’t so much stop being baffled as expect to be baffled.
As my dad put it, “I never bother reading the boundary announcements. The lines keep changing anyway.”
If you want to understand our electoral boundaries, don’t expect much help from the EBRC, which is opaque in its operations and tight-lipped in its reports.
For how anticipated they are, the EBRC reports are entirely underwhelming. They are rarely more than 15 pages or so, and have gotten skimpier over time.
Older reports used to explain why certain constituencies were added or removed. But since 2006, the only explanation supplied is a one-liner: the changes take into account districts’ ‘current configurations’, ‘population shifts’, and ‘housing developments’.
‘Population shifts’ is such a broad catch-all that it could mean just about anything.
At the very least, it suggests that there is a method to the madness. No definition of ‘population shifts’ has been supplied, but it presumably means that SMCs and GRCs get redrawn to reflect increases and decreases in their population, as flats are built and demolished and people move in and out.
But even if we do take this rationale at face value, there are discrepancies.
We took a closer look at the numbers—and found that the ‘population shifts’ rationale doesn’t always hold up.
How Boundaries Are Drawn Up: A Quick Primer
To understand why ‘population shifts’ doesn’t always stack up, we must first understand the boundary-drawing process. Only the EBRC knows exactly how it all works, but we can piece some things together based on its reports.
1) Estimate the total number of electors, based on the Register of Electors at a particular date.
2) Estimate how many electors each MP currently represents, based on the total number of electors and the existing number of MPs. The 2020 report puts this as 29,200 electors per MP.
3) Establish a range for how many electors an MP should represent. Based on ‘past practice’, the EBRC calculates this as a 30% deviation from the figure in Step 2 (ie. +/- 30% of 29,200). For GRCs, the range is multiplied by the number of MPs.
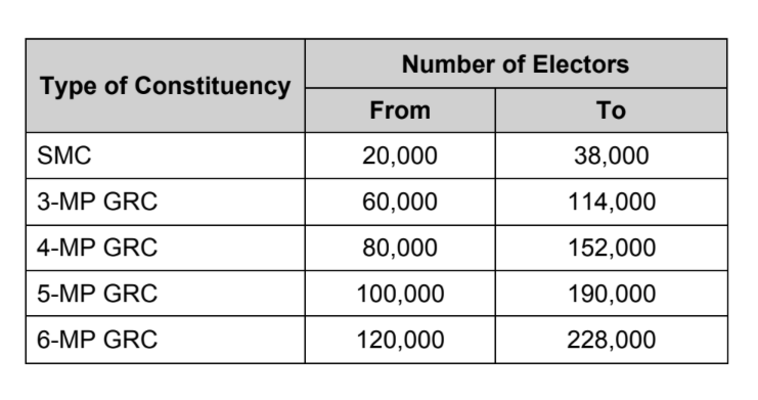
4) Adjust the electoral boundaries to meet these ideal ranges, based on ‘population shifts’ and ‘housing developments’.
(There are some other guidelines which should be followed, such as raising the number of SMCs while shrinking the average size of GRCs over time, or increasing the number of MPs to match a growing population, but these can change with the specific directions given to the EBRC. However, there is no exhaustive list, and it’s unclear how the EBRC applies them.)
Case Study 1: Why SMCs Get Killed Off, Or: The Mysterious Longevity of Potong Pasir
Step 4 of the process is where it gets messy.
If population shifts cause boundary changes, then disappearing constituencies ought to show significant increases or decreases in their electors. The clearest sign of this is that a constituency has gone under or over its recommended elector range.
Most of the time, this isn’t actually the case.
Here are the figures for the SMCs which were absorbed in the last three elections, comparing the number of electors in each SMC with the recommended elector range in the year it was dissolved.
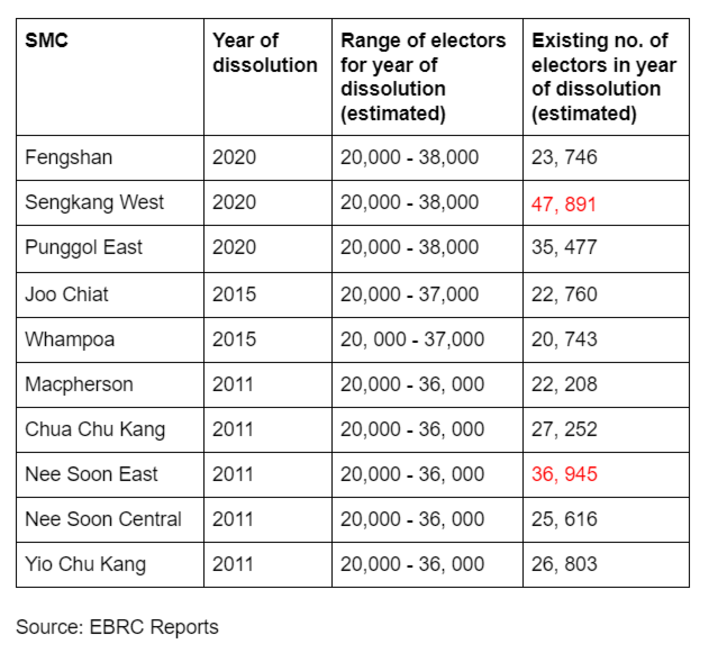
As these show, only Sengkang West and Nee Soon East were out of range at the time they were dissolved (the former by a huge margin, the latter only slightly). The others were all within range, but were dissolved anyway.
This looks even more bizarre when compared with the former Opposition stronghold of Potong Pasir SMC. Until this year, it was under-range for every election since 2001, but the constituency has been retained all the way.
What gives? Why did all those SMCs get the chop, while Potong Pasir was kept alive? Why were changes made where they didn’t seem merited, and not made where they did?
If nothing was broken, why bother fixing it?
Given the inconsistencies, it’s also perfectly understandable why Opposition parties cry foul whenever SMCs are absorbed.
Conventional wisdom suggests that SMCs are easier for Opposition parties to contest because they need to stump up fewer candidates. As such, whenever they get reabsorbed, Opposition parties tend to assert that this was done to strengthen the PAP’s hand.
The WP’s Yee Jenn Jong, for example, lost Joo Chiat SMC by only 1% of the vote in 2012, only for it to be absorbed into Marine Parade GRC in 2015. One of the latest casualties, the soon-to-be-defunct Punggol East SMC, was hotly contested in the last few elections. The WP won 49.24% of the vote there in 2015.
Case Study 2: The Curious Case of Jalan Besar and Moulmein-Kallang
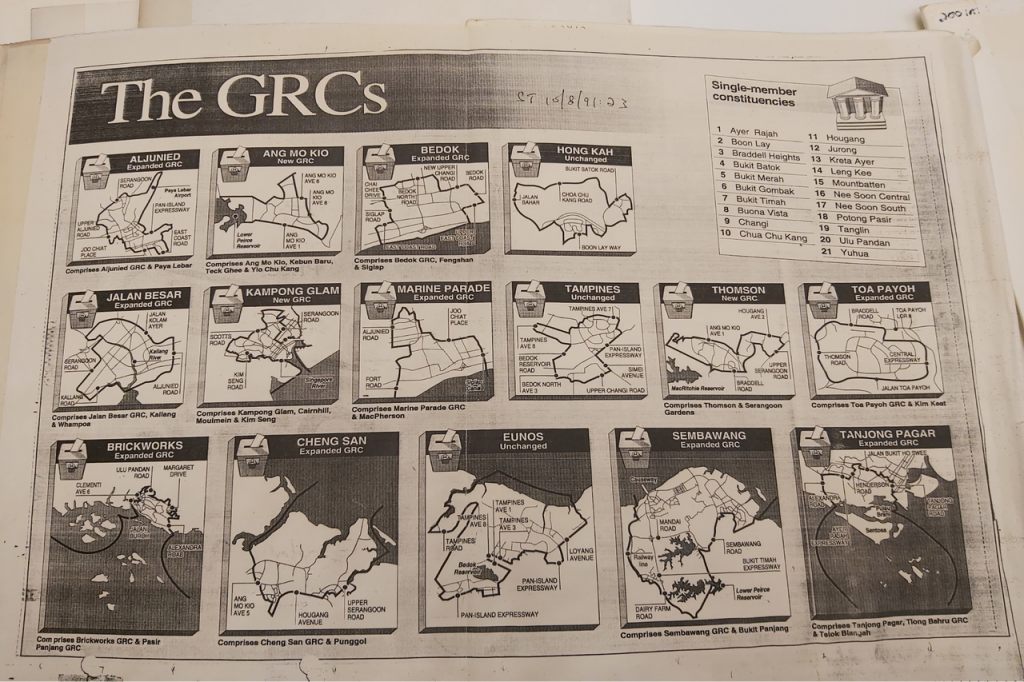
To really appreciate the full head-scratching effect, look at the disappearance, and subsequent reappearance, of Jalan Besar GRC between 2011 and 2015.
In 2011, Jalan Besar GRC, then a 5-seat GRC, was dissolved, and the majority of its electors were absorbed into the newly-created Moulmein-Kallang GRC. In 2015, after just one election cycle, Moulmein-Kallang was dissolved and Jalan Besar brought back to life as a 4-seat GRC.
If this already sounds pointless, the numbers seem to support this.
At the time of its dissolution in 2011, Jalan Besar had an estimated 97,521 electors. The recommended range for a 5-MP GRC at the time was 100,000—180,000 electors, meaning it was around 2,500 short.
The bulk of its electors were absorbed into the newly-created Moulmein-Kallang GRC, a 4-seat GRC with an estimated total of 87,498 electors.
This figure had barely changed when Moulmein-Kallang was dissolved in the next election.
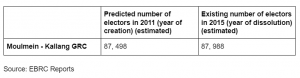
A difference of 500 electors is nothing. As a 4-MP GRC, it could have absorbed 50 times that and remained within range. It stretches the limits of logic to see how this was a ‘population shift’ significant enough to justify dissolving the GRC after just one election.
To top all this off, the reformed Jalan Besar GRC (now 4 MPs) actually had more electors than when it was a 5-MP GRC in 2011. The 2015 report estimated that it would now have 102,454 electors for 4 MPs, compared to 97,521 and 5 MPs in 2011.
In summary, a GRC was dissolved and a new GRC created in its place. This new GRC was then dissolved in the next election, despite a barely visible ‘population shift’, and replaced with a version of the first GRC on terms less favourable than its predecessor’s.
Was there a point to all this? Presumably there was. Hopefully there was. But the numbers don’t seem to show it.
Unfortunately, we may never have the answers to these questions. Only the EBRC has the full picture. The whole process is shrouded in such secrecy that all we can do is speculate.
Still, the inconsistencies raise doubts about ‘population shifts’ as the driver behind our ever-changing electoral boundaries. If the changes seem stupid and arbitrary to ordinary Singaporeans, this is entirely the EBRC’s own fault.
The EBRC—which, as part of the Prime Minister’s Office, is separated from politics by the thinnest of Chinese walls—has told us that there is a logic to the process. But by expecting us to take said logic at face value without ever explaining how it works, it becomes a question of blind faith, not rationality. And as a result, what might well be a perfectly reasoned process just looks totally senseless.
Other countries also re-draw their boundaries, albeit with varying degrees of transparency. Accusations of gerrymandering abound in the US, where the process is largely partisan. In the UK, however, the process is carried out by independent Boundary Commissions for England, Scotland, Wales, and Northern Ireland. A judge is appointed to lead each of these, and all their minutes and findings are published online.
In contrast, the process in Singapore is so opaque and unpredictable that you can’t blame people for not caring after a point. You can’t, however, also accuse ordinary Singaporeans of being ‘disenfranchised’ and ‘apathetic’ about politics when we’re constantly kept in the dark.
So where does this leave us? The boundary-drawing process is still confusing. It looks as bizarre as ever, if not more so. It means allegations of gerrymandering will continue to be made. And unfortunately, all this will probably stay the case indefinitely.
Just like Hougang and Potong Pasir. Those will probably never change.
Only the EBRC knows for sure, but we think our maths stacks up. If you think otherwise, let us know at community@ricemedia.co.