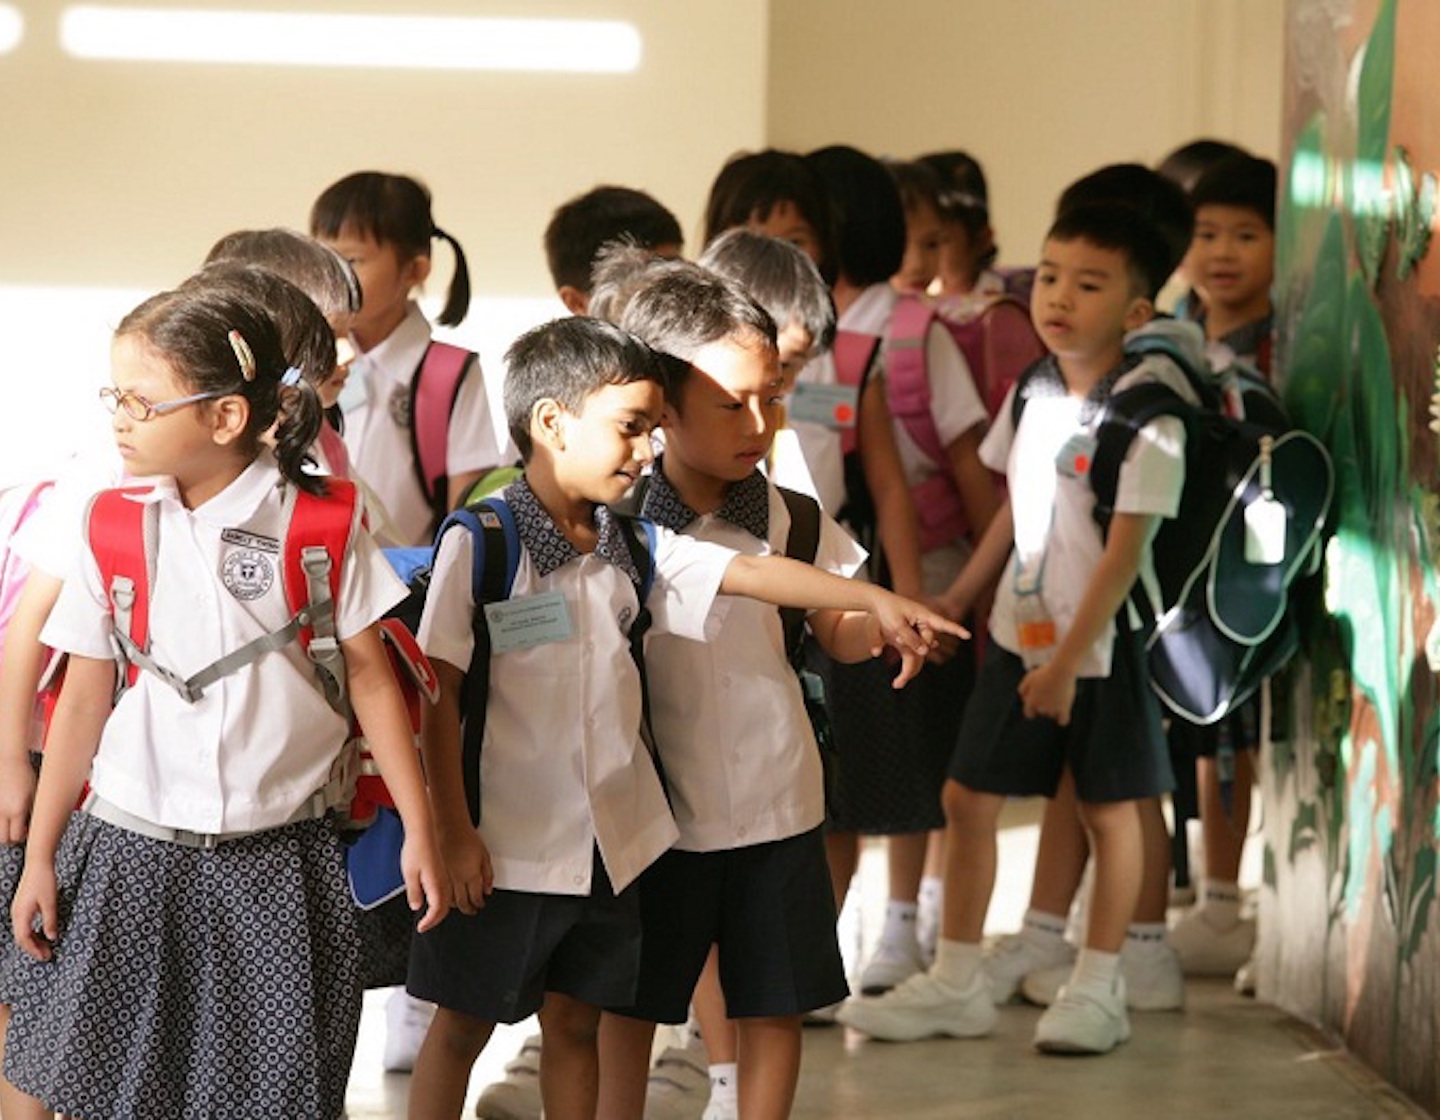
The annual Primary One registration frenzy has begun, with The Straits Times reporting that more than half the vacancies were filled up at 17 schools after Phase 1. This year’s registration exercise comes two months after President Halimah Yacob declared tackling inequality a national priority, which motivates the question of what role the admissions process plays in this issue.
DPM Tharman Shanmugaratnam has said that Singapore’s education system should work to mitigate the “lottery of life,” in which some children are born with more advantages than others. Yet, as others have argued, the P1 admissions process—the first point at which students are systematically sorted in the education system—awards advantages to those who are already advantaged. Rather than mitigating the lottery of life, the P1 admissions process perpetuates it.
Here’s a summary of the seven phases in the registration exercise:
| Phase | Qualifying Criteria |
| 1 | Sibling is a current student at the school |
| 2A1 | Parent is a member of the alumni association OR Parent is on the school’s Management/Advisory Committee |
| 2A2 | Parent or sibling is an alumnus/alumna of the school OR Parent is a staff member OR Applicant attended a co-located MOE Kindergarten |
| 2B | Parent volunteered at least 40 hours for the school in the year prior OR Parent is a member of an affiliated clan or church OR Parent is an endorsed community leader |
| 2C | All other students who are not yet registered at the end of 2B |
| 2CS | All other students who are not yet registered at the end of 2C |
| 3 | Non-citizens and non-PRs |
Notes: (1) After Phase 1, whenever a school is oversubscribed, it holds a ballot. Singapore citizens and children living near the school have priority in the ballot. (2) Since 2014, MOE policy has stated that schools must reserve 20 spots each for Phase 2B and Phase 2C.
Why should the children of alumni be treated any differently? What types of parents have the time to volunteer? Who has the money to purchase properties that are closer to popular schools? And who has the savvy to navigate the entire process? It’s not hard to infer that it tends to be the socioeconomically privileged children who have better chances in this process.
But to what extent, precisely, do these children have a greater probability of getting into the schools of their choice? This is nested in a bigger question: For any given child born in Singapore, what shapes his or her pathway towards success (however “success” is defined)?
Singapore’s promise of meritocracy states: if work hard, will do well. But years ago, National Institute of Education professor Jason Tan warned of a growing “parentocracy” in Singapore, where it is parental resources, not hard work, that influence one’s chances of success. The most visible manifestation of this is the amount of money that parents spend on tuition and enrichment classes. But as sociologist Teo You Yenn observes, endowed advantages also come in subtler but equally consequential forms: the type of English that is spoken at home, or how much time parents spend reading to their toddlers.
It is difficult to identify every source of parental influence and level the playing field in each instance. Nonetheless, the least we can do is to critically examine the fairness of the sorting mechanisms we have designed, such as the P1 registration exercise.
To understand the extent to which the admissions process awards priority to children who are already privileged, we should study the socioeconomic profile of students admitted in each phase. However, the data we would need are not publicly available. Short of that, there is still much we can learn from a simple descriptive analysis of the number of students admitted in each phase at each school.(1) These data provide the broader context for a discussion that has so far been driven largely by the anecdotal experiences of parents enrolling their children at popular schools.
First, the admissions process denies students places in the schools of their choice. Doors are closed on these children at an early age. This is understandable, given that popular schools usually begin to be oversubscribed from Phase 2B. However, we need to ask who is being turned away and why.
On average, 10% of those registering in Phase 2B are denied admission. These children have parents who are willing and able to volunteer, but are not otherwise connected to the school. 15% are turned down in Phase 2C, and 6% in Phase 2CS. These children are those who have no prior connections, and whose parents have neither the time nor mental space to volunteer. And in every ballot, those turned down are more likely to be those whose parents do not have the spare cash to afford expensive homes near the school.
An average of 315 students were denied in Phase 2B, 2,249 in Phase 2C, and 143 in Phase 2CS. This constitutes 8% of the total cohort.
What about the proportion of students who have an advantage thanks to their parents? On average, 21% of the cohort gets admitted through the three “parental advantage” phases (2A1, 2A2, and 2B), as the following chart shows.(2)
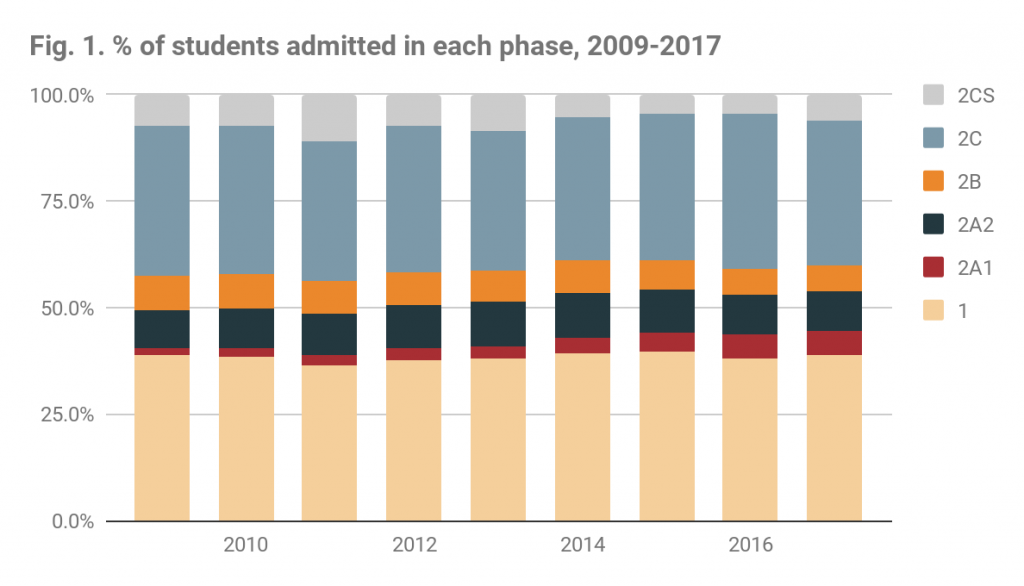
A portion of the students admitted in Phase 1, through a sibling connection, could also be benefiting indirectly from parental advantage (we’d need to know how the first sibling was admitted). That would in fact make 21% an underestimate of how many students benefit from their parents’ resources.(3) In addition, we do not know the number of students who benefit from the proximity advantage in the ballot.(4)
Furthermore, some parents without connections to popular schools decide against trying to enroll their children there in the later phases, because there is a chance that their children will not be selected in the ballot. Yet other parents may implicitly categorise popular schools as altogether not an option, because they feel their children do not belong among more well-off students. These behaviours are not captured in the data; if they were, the number of students being “denied” opportunities would be higher.(5)
The Ministry of Education is better-equipped to provide a more comprehensive picture of advantage and disadvantage in the registration exercise. They are also in the best position to consider whether revising the admissions scheme will do much, when compared against other policy possibilities, to give all our students a fairer shot in the education system.
But however major or minor the policy opportunity, admitting students based on inherited advantage is antithetical to our professed commitment to meritocracy. This alone warrants scrutiny.
Creating Unequal Learning Environments
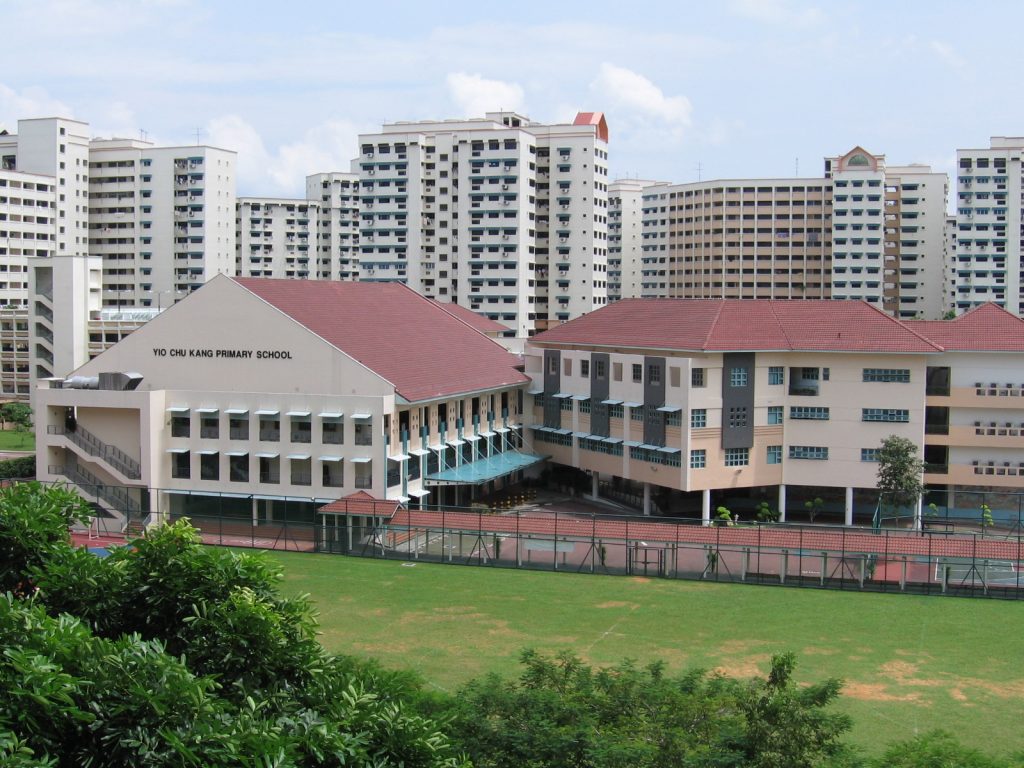
Besides distributing opportunities unequally, the registration process also has an impact on the socioeconomic profile of students at each school. Students are sorted into the most popular and least popular schools based on factors linked to socioeconomic background. The following visual illustrates the disparity in the popularity of different schools:
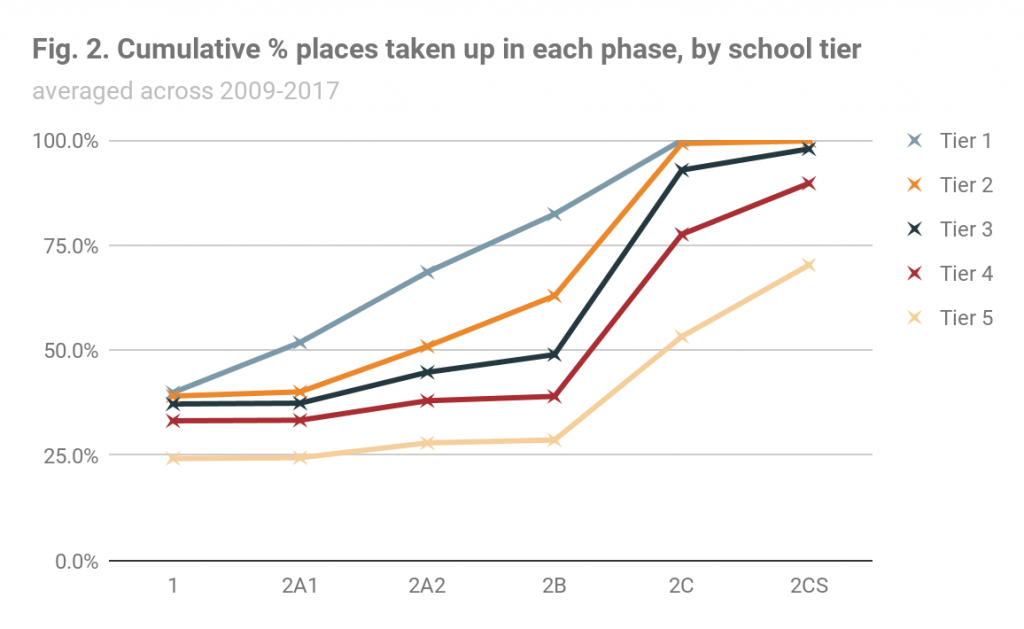
In Tier 1, an average of 82% of vacancies is taken up by the end of Phase 2B. The maximum is 93%; in this case, only 27 spots (7%) are left for students with no sibling or parent connections to the school.
The disparity in admissions profiles looks even starker in absolute numbers:
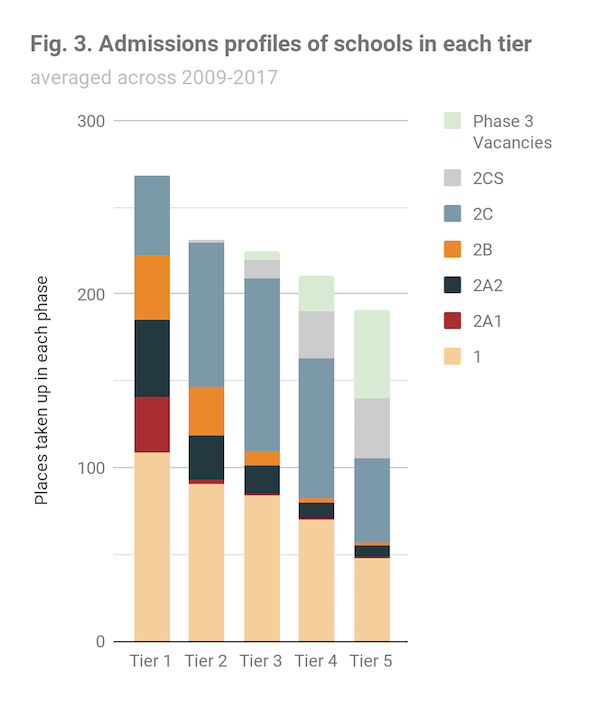
So the students who benefit from their parents’ resources concentrate within a narrow band of schools at the top of the popularity rankings. Less privileged students either self-select into less popular schools, or go there after being turned away from popular schools. This is inequality in the making.
The parents who are savvy and involved enough to secure a spot are likely the same parents who will track their children’s progress closely and send them for enrichment classes, helping to ensure their success in the system. Correspondingly, the children who did not receive much help from their parents in registering for P1 are more likely to be on their own in navigating the demands of school in later years.
By concentrating children of certain backgrounds within certain schools, the admissions process contributes to the creation of unequal learning environments across the P1 cohort from the get-go. Moving towards a system that distributes students more evenly would result in schools with a more heterogeneous mix of students from different socioeconomic backgrounds.
But how might we get there?
To its credit, MOE has made efforts towards this end.
In 2013, former Education Minister Heng Swee Keat introduced the now-ubiquitous tagline that “every school is a good school.” In other words: Every school has its strengths, and parents should choose a school based on their children’s interests and needs, rather than seeing all the schools as ordered along a single dimension of “quality.”
While I am personally aligned with the vision of this policy, it seems parents still have their own ideas about which schools are “good.” Whereas the percentage of students enrolling via Phases 2A1, 2A2, and 2B hovered between 19% and 21% from 2009 to 2013, since 2014, it has remained between 21% and 22%. The “good schools” rhetoric has been insufficient to reduce the competition.
In addition, since 2014, MOE has been reserving 20 vacancies for Phase 2B and 20 for Phase 2C at each school, to “ensure continued open access to all primary schools.” But the numbers suggest that the impact of the policy has been limited at best. Between 2014 and 2017, there were only nine schools that had exactly 20 vacancies in either Phase 2B or Phase 2C in at least one of the years. The other schools had more than 20 spots available in each of the two phases. As such, the policy has succeeded in reserving a minimum number of places, but only at a small handful of schools.
Why have we, as a society, not seriously considered a bolder overhaul of the P1 admissions system?
What about criteria for the balloting process?
In the current system, children living near the school have an advantage. Doing away with this criterion would make the process fairer. However, it does serve a logistical function, since it is easiest for a child to attend a nearby school. In addition, taking away the alumni and parent volunteer criteria without removing the proximity advantage could simply turn competitive parents’ attention solely towards buying properties near the schools of their choice.
Another question is how schools currently rely on parent volunteers, and whether they would be able to do without them should the volunteer criterion be removed. (Already, some schools have done away with their parent volunteer schemes because they cannot use the help.)
Developing a clean solution would require more data and multiple conversations with stakeholders like schools, parents, alumni associations, and clan associations. Even then, simply editing our sorting criteria will only do so much. If the advantage of focusing on specific policies is that it provides concrete direction, the risk is that we may give ourselves too much credit for too little change, ticking “inequality” off our Policy Priorities list and moving on to something else.
In the long term, the more sustainable solution is a change in the way we recognise “quality”—in our schools, but more significantly, in our students. The competitiveness of the admissions process—and the inequality that it therefore engenders—is fed by a hierarchical view of “elite” and “neighbourhood” schools, and by the belief that academic performance is the most important ingredient for future success. Tinkering with admissions policies without changing this fundamental view will simply result in MOE policymakers and “kiasu” parents trying to outsmart one another at their game.
Genuine cultural change will depend on a deep shift in our collective mindset. This means employers looking beyond academic credentials when hiring, parents recognising that there is more to develop in children than their ability to test well, and each of us chipping away at our entrenched stereotypes about students who go to “good” and “bad” schools. Only then can we move towards a system that truly values a range of talents, and away from our zero-sum game of academic winners and losers.
(1)The data analysed in this article cover the nine years from 2009 to 2017. I downloaded them from Elite.com.sg, which provides information to parents to help them navigate the registration exercise. I cross-checked a sample of the data with the numbers provided on the Kiasu Parents forum and they line up.
(2) This is somewhat in line with the results of an Institute of Policy Studies survey conducted in 2016, which found that more than three-quarters of respondents “had not done anything to actively secure a good school for their child.”
(3) That said, a portion of the students admitted in Phase 2A2 may be children of staff members or may have attended a co-located MOE Kindergarten. Neither of these indicates parental advantage. We lack the necessary data to know how many students fall in these categories.
(4) When analysing such data, one would also have to look at the relative property prices of the homes within a 1-km and 2-km radius of each school. In and of itself, benefiting from the proximity advantage does not necessarily indicate coming from a privileged background, unless property prices are high in that neighbourhood.
(5) On the other hand, 8% is probably an overestimate, as some of the applicants turned down in Phase 2C and 2CS may have been the same applicants turned down in the earlier phases. The 8% therefore includes some children who are counted twice, though even accounting for this is unlikely to change the number significantly.
(6) There are actually 184 schools in total. However, the measure that I used to rank the schools, i.e. the percentage of places taken up by the end of Phase 2B, penalises the youngest schools. These schools are too young to have alumni who are parents, and it would take a few years before a new student can be admitted via a sibling connection. I removed the fourteen new schools that have been in operation for fewer than seven years. I chose seven years as the cut-off because the first entering cohort would have graduated within six years, and the seventh year of data would capture parents’ responses to the academic performance of the graduating students, which I assume is salient to their decision. Without removing these schools, the disparity appears larger.