Jo Teo is a theoretical physicist at the University of Oxford Mathematical Institute. In this op-ed for RICE, they use their mathematical skills to calculate the way to further political awareness.
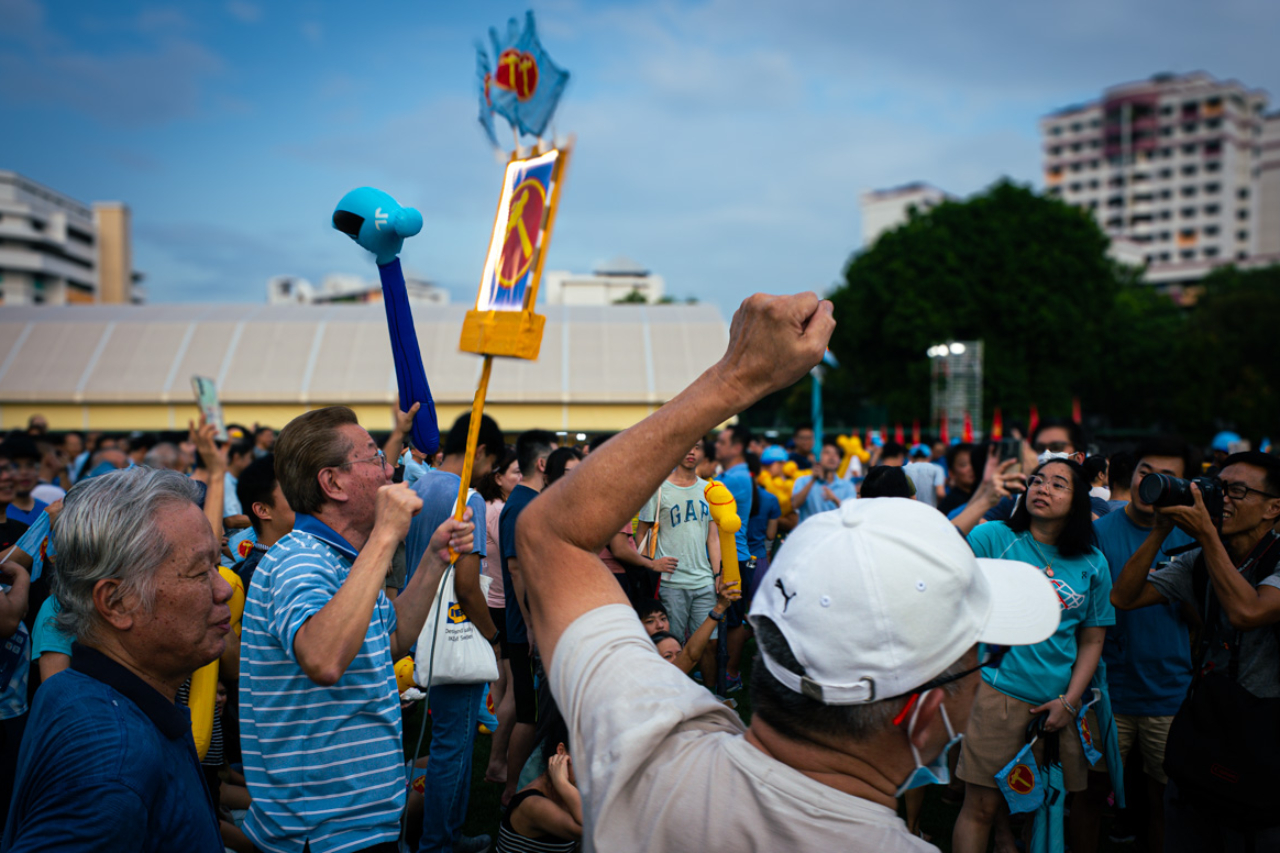
Top image: Zachary Tang / RICE File Photo
We think that GE2025 is defined by just one number: 65.57 percent. An all-too-familiar result, an all-too-familiar parliament, and an all-too-familiar political landscape?
Not quite.
GE2025 ushered in a new era of Singaporean politics. From welcoming the Gen Z electorate to the rise of podcast politics, and a surge of citizen-led, data-driven commentary, the political scene boasted fresh new faces—even if the final result pointed toward preserving the status quo.
I am Jo Teo. Some of you might have read about my time in Okinawa here on RICE. Others might know me as the botak quantum physicist who broke down the electoral boundaries in the weeks leading up to the general election.
In this piece, we’re diving deep into the data behind GE2025. But this time, we are taking the focus off the political parties and bringing the spotlight back onto us, the rakyat.
Voting Power
Not all votes hold the same value. That’s not a metaphor, it’s a mathematical fact.
We can think of voting as representation. A Member of Parliament (MP) is carrying the voice of their voters into Parliament, and they are also serving you in the community.
Imagine two classrooms: one with 20 students, another with 30. Which teacher would be better able to give each student personalised attention? Which classroom would you rather enrol your child in?
It’s the same with our MPs. Some represent over 33,000 constituents, such as in Bukit Panjang SMC. Others represent as few as 22,000, such as in Kebun Baru SMC. The smaller the ratio, the more bandwidth an MP has to listen, respond and follow through.
The 50 percent discrepancy in voting power and representation, merely based on where we live, is striking. And in some districts, that gap isn’t just large, it’s growing.
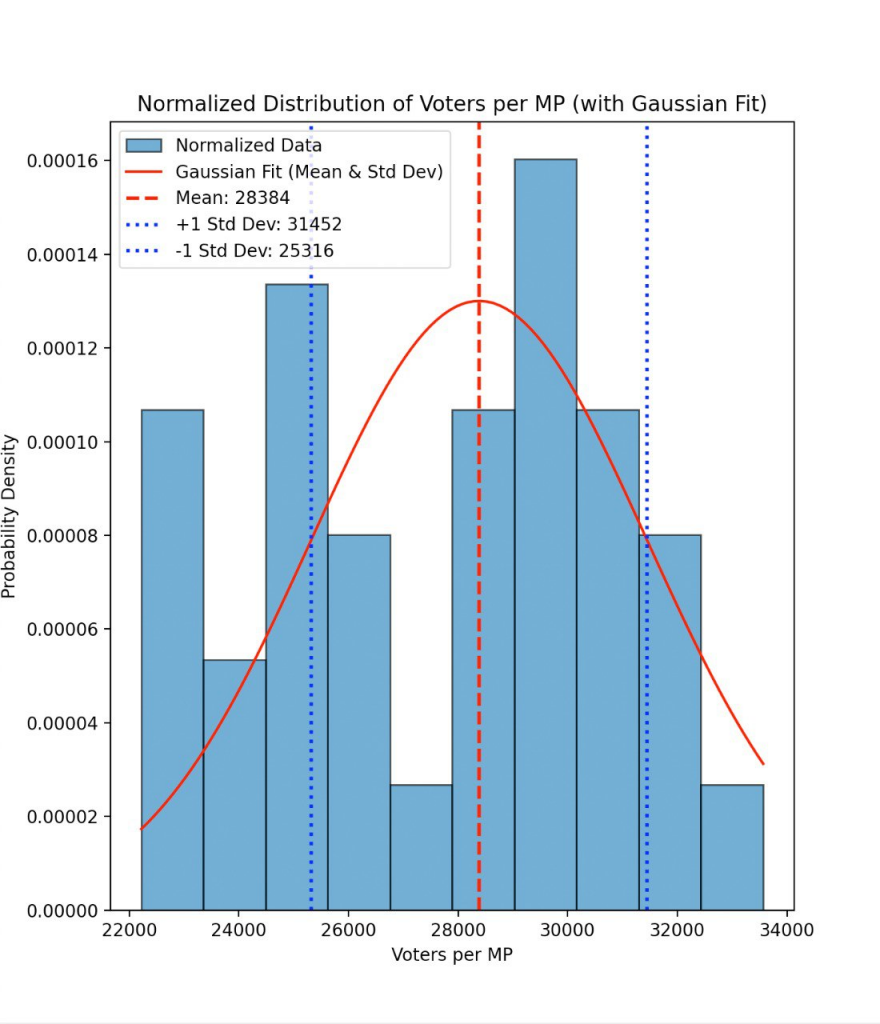
Each bar in the figure above represents the proportion of districts that fall under a given range for the Elector-to-MP ratio. As discussed, the ratios range from 22,000, all the way to 33,000 electors per MP. The distribution is very spread out, pointing towards stark inconsistencies in citizens’ voting power across districts.
I compared your voting power between 2020 and 2025 in Figure 2 (See if you can spot your district!) below. What surprised me most was Potong Pasir SMC, which saw a 60 percent increase in the elector-to-MP ratio, from 19,700 to 31,000.
[Author’s note: If your district is newly introduced in 2025, we compare your current elector-to-MP ratio with the national average.]
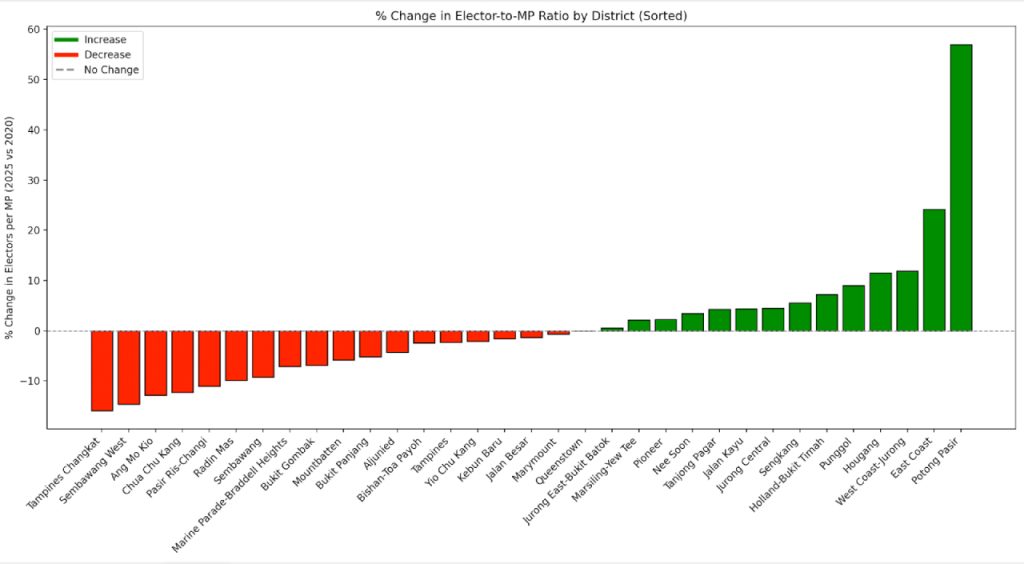
Most other districts saw a change within 20 percent of their 2020 values.
So, are you just lucky if you happen to live in Kebun Baru SMC or Tampines Changkat SMC? When we look at the numbers leading up to GE2025, a pattern begins to emerge. Let’s have a glance.
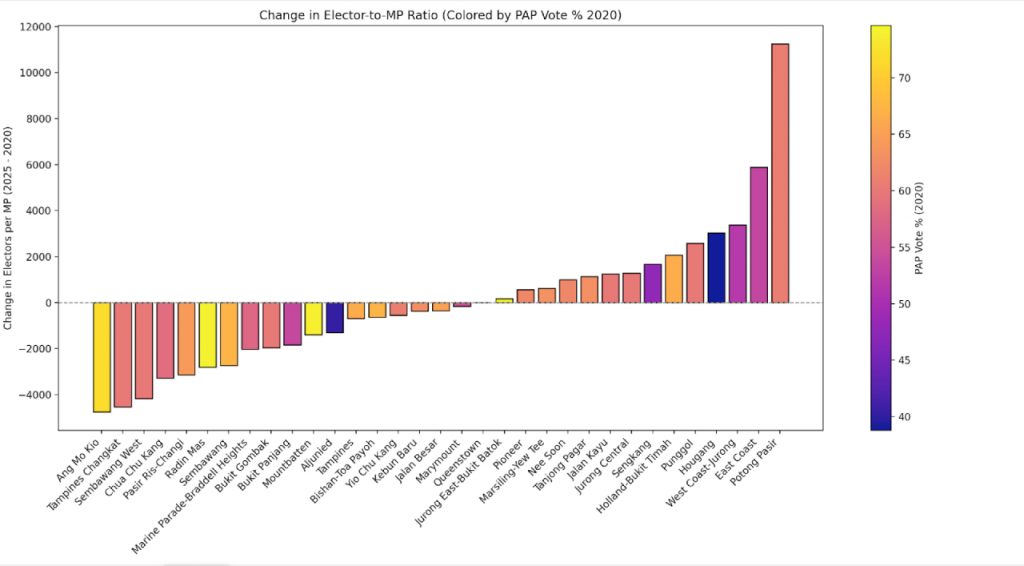
In the figure above, the yellows and oranges correspond to districts that were better performing for the ruling party, and the darker colours point to districts where they didn’t do so well.
Maybe we can already identify a pattern. Districts where the ruling party performed more weakly in GE2020 tended to have their elector-to-MP ratios increased. In simpler terms, your voting power was reduced just one election cycle later.
On the other hand, districts that voted in overwhelming favour (over 70 percent, in yellow) of the ruling party were consistently ‘rewarded’ with increased voting power.
For example, consider Ang Mo Kio GRC, the district that experienced the greatest increase in voting power. The People’s Action Party (PAP) won 71.91 percent of the vote share in 2020, and 2020’s Ang Mo Kio GRC was split into 2025’s Ang Mo Kio GRC and Jalan Kayu SMC. The same geographic area, going from five MPs to a total of six MPs within just an election cycle.
Let’s make sure our eyes aren’t fooling us.
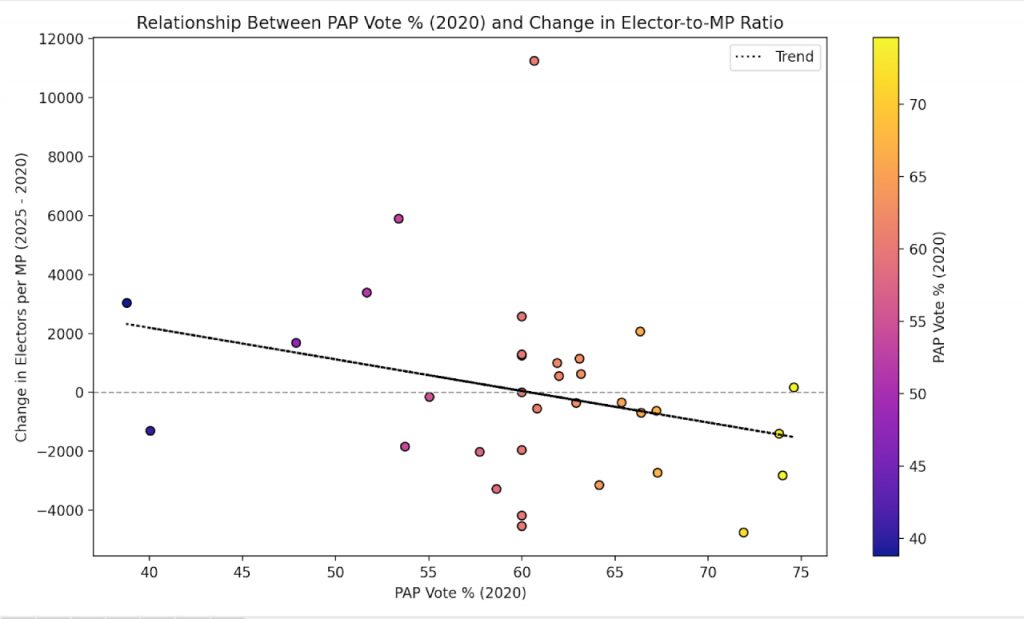
Yep, just what we thought. A more favourable vote for the ruling party does indeed correlate, albeit weakly, with an increase in voting power between cycles.
Now, it’s important for me as a scientist to stress that correlation isn’t causation. The trend we’ve identified isn’t statistically overwhelming, but it’s consistent. Let’s not forget, at the end of the day, it’s us, the people, who are bearing the brunt of these political changes.
What could this mean? It could be a single mother who might have to wait longer for her Meet-the-MP session. It could be the young couple whose feedback about playground safety in their new BTO estate taking months, instead of weeks, to address. It could be the elderly retiree who finds their weekly Zumba and calligraphy classes cancelled, or even oversubscribed, with a Town Council spread thin across more constituents.
It’s also the MP, forced to stretch the same resources with 50 percent more workload, all while drawing the same salary.
When the weight of your vote is arbitrarily determined by where you live, or even worse, potentially influenced by your voting history, it stops becoming a technicality. It becomes a question of fairness.
But remember, the focus here is not on political theory; it’s on the voters. We’re not here to accuse or speculate on intent. We’re here to look at the numbers—and ask what they mean for us, the rakyat.
Still, for those interested, the concept of packing in electoral strategy offers useful context. Hypothetically, voters can be shifted from stronger-performing districts to weaker ones, effectively ‘diluting’ the vote in areas that were once more competitive.
Redrawn, Reassigned, Reintroduced
Beyond the inconsistencies in voting power, many Singaporeans face something even more disorienting: the constant flux of changing electoral boundaries.
Imagine staying in the same flat for 20 years—same MRT, same kopitiam, same neighbours—but every five years, you’re handed a new political identity. A new district name. A new representative. A new Town Council to call. And with it, the need to rebuild rapport from scratch.
Let’s have a look at the most famous example from GE2025: Marine Parade-Braddell Heights GRC. When we overlay the 2020 and 2025 electoral maps, the shift in boundaries is unmistakable. In numbers, the new boundary retains only a 55 percent fidelity, a measure of spatial overlap, to its previous version.
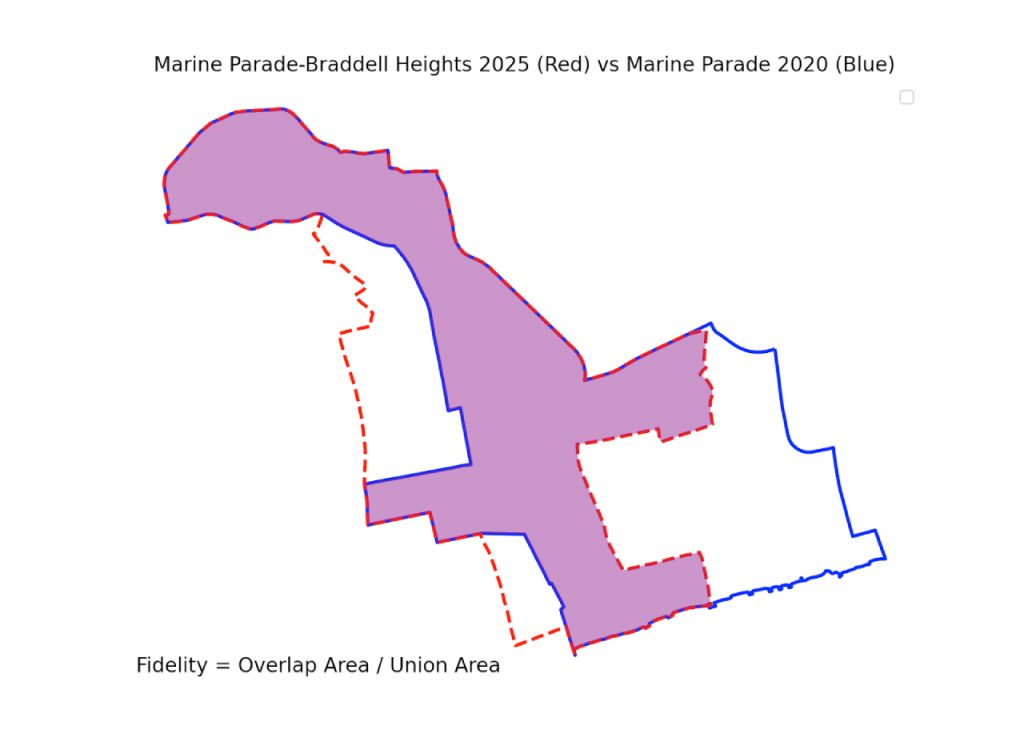
A score of 100 percent would indicate a perfectly consistent, unchanged district. In GE2025, only nine out of 33 districts remained unchanged: Bishan-Toa Payoh GRC, Jalan Besar GRC, Marsiling-Yew Tee GRC, Nee Soon GRC, Sengkang GRC, Bukit Panjang SMC, Hougang SMC, Marymount SMC, and Pioneer SMC.
[Author’s note: Yes, some districts were renamed. Marine Parade became Marine Parade-Braddell Heights, for example. We still chose to compare these districts because, at the end of the day, it’s the same people living in the same flats. The name might change, but the people and homes have not.]
If you support an opposition party, the shift can feel even more jarring. You might see your candidate—someone who has invested years, maybe even decades of their efforts, in the community—suddenly contesting in another part of the country because your district has been dissolved.
Bukit Batok SMC comes to mind—the opposition presence there, the Singapore Democratic Party (SDP), saw its efforts down the longkang, not because residents moved, but because the lines did. SDP chief Dr Chee Soon Juan was effectively forced to change his strategy.
Sure, electoral boundary impacts all political parties, including the ruling PAP. But it’s important to note that the consequences are often not felt evenly. The PAP, with its deep bench of members and volunteers, as well as its longstanding grassroots presence in every ward, is often better positioned to adapt swiftly and effectively to redrawn electoral maps.
Meanwhile, opposition parties may have to scramble to recalibrate strategy, redeploy limited resources, and build new ground presence. In fact, the numbers would suggest that the ruling party benefits when boundaries are redrawn.
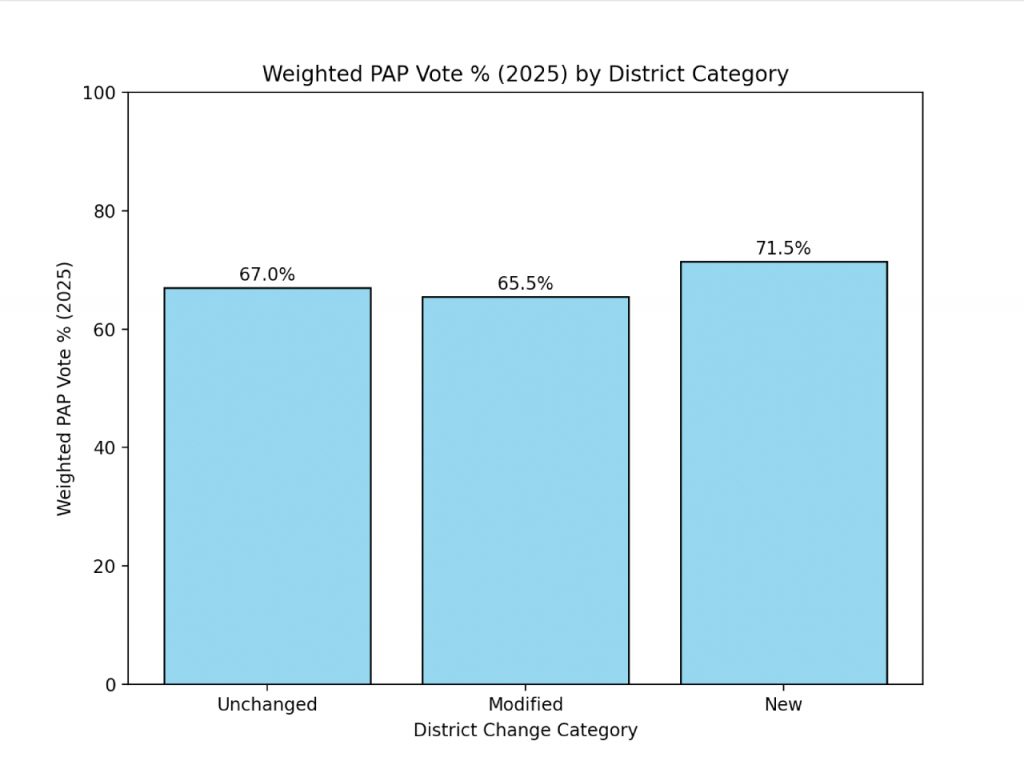
Categorising the districts into unchanged, modified and newly-introduced relative to the 2020 electoral cycle, we can identify some trends in electoral performance. The only group that consistently outperforms the national popular vote is the newly introduced districts.
Whether intended or not, the incumbent benefits from newly delineated districts.
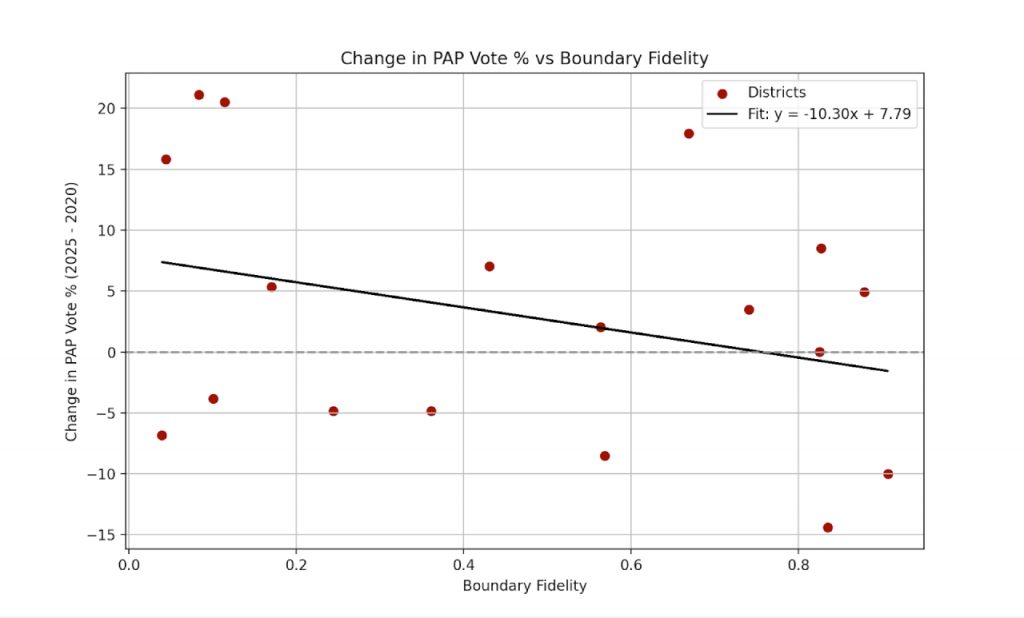
We now look at the specific change in vote share relative to how much the boundaries have changed.
Again, data suggests that a greater modification of the electoral boundaries correlates with an improvement in the vote share for the ruling party. This is expected, since the earlier plot showed that new districts are most likely to outperform other districts.
Some specific examples come to mind. The ruling party won West Coast GRC with 51.68 percent of the vote in 2020, and West Coast-Jurong GRC 60.1 percent of the vote in 2025. Queenstown and Jurong Central, both newly formed SMCs in 2025, showed an improvement over the 2020 popular vote of more than 20 percent.
Doing The Math
One of the quiet triumphs of Singapore’s housing policy is the belief that ownership creates rooted and engaged citizens. The same should hold true for democracy.
But how can we feel ownership over our political future when our districts feel so arbitrary and temporary? How do we build long-term trust and community when the ground keeps shifting beneath our feet?
In GE2025, I estimated that 42 percent of voters experienced a district change—either from being assigned to a newly-introduced district, or from being shuffled across the boundaries of existing ones. That’s nearly half the electorate reassigned, redrawn and reintroduced. Again.
[Author’s note: The 42 percent consisted of all the voters within newly-introduced districts, and a proportion of voters within modified districts (weighted by their fidelity scores). For example, if a district scored 0.9 out of 1, I estimated that 10 percent of their voters were moved across boundaries. Our estimates of populations shuffled across boundaries had to assume that population density within a district is uniform, since we do not have access to electoral data with polling station-level resolution.]
It’s so easy to get swept up in talk of political parties, party loyalty and party wins. But we must never forget: politics is, and always should be, about the people.
The rakyat.
I may be known for doing the math, but I will be the first to admit that our votes are not only about the numbers. They represent who we are, what we care about, and the country we want to build together.
I have always believed in country before party. And I sincerely hope that those in positions of power, elected or otherwise, will live up to that same principle.
At the end of the day, what matters is that we feel heard, represented and empowered. GE2025 may be over, but the conversation about our democracy and our place in it is only just beginning.
So let’s keep watching. Let’s keep asking tough questions. And let’s keep showing up. Not just every five years at the ballot box, but in our daily lives as well.